AskPostgreSQL : Ask your database a question, in English
| Stack | Next.js 15, PostgreSQL, GPT-5 Mini, Recharts, NextAuth.js |
| Focus | Natural language to SQL, LLM pipelines, data visualization |
What it does
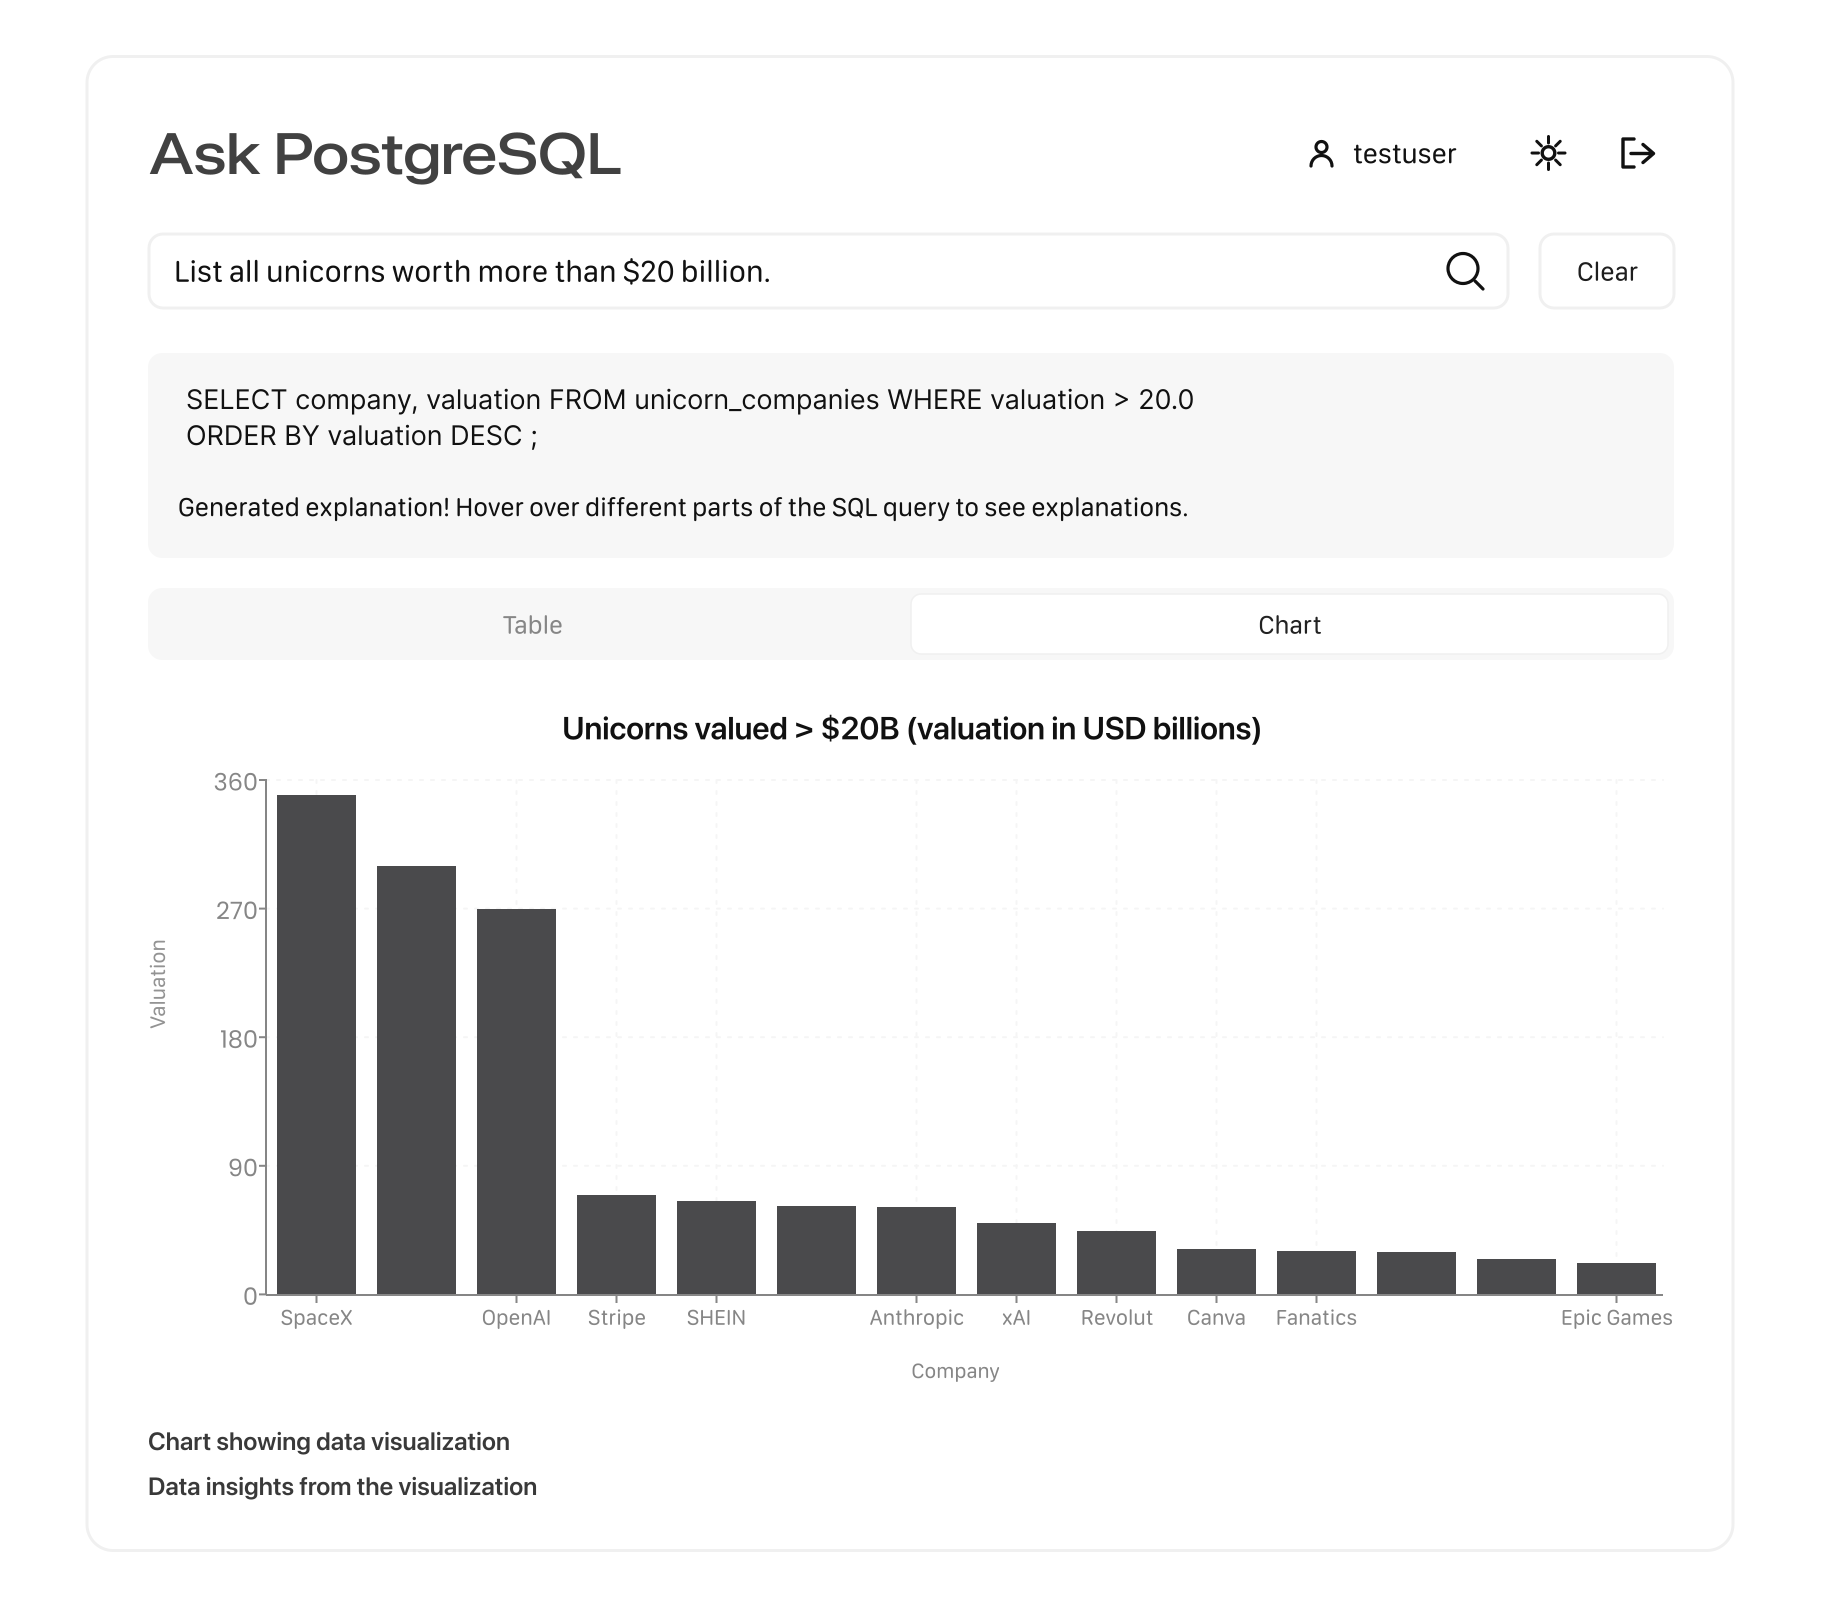
AskPostgreSQL turns a plain English question into a working SQL query, runs it, explains what it did, and draws the right chart, all from one request. Ask "which industry has the highest average valuation in Europe" and get back a bar chart, the exact SQL behind it, and a plain-language breakdown of what each clause does.
The problem with chat-your-data tools
Most people who want an answer from a database don't want to learn SQL to get it. Most "chat with your data" tools either hide the query entirely, which makes the answer unverifiable, or dump raw SQL on someone who can't read it, which makes the tool useless to the person who needed it in the first place.
AskPostgreSQL shows both: the answer, and the exact query that produced it, explained in order.
Four calls, question to chart
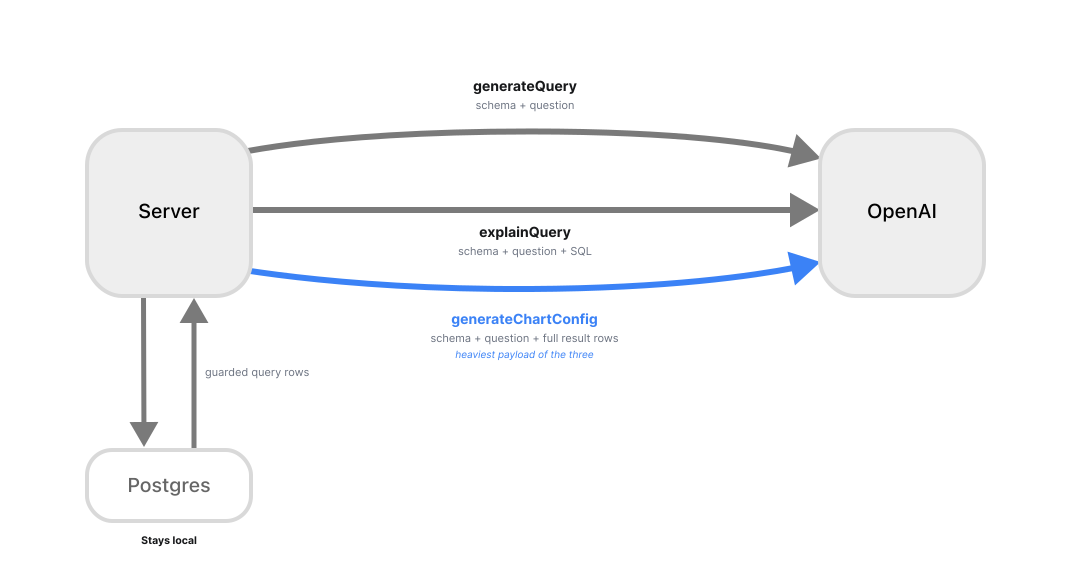
Four steps carry a question from text to chart, three of them calls to GPT-5 Mini, one a local check that deliberately isn't:
- 01
generateQuery
Turns the question into a single SELECT statement, given the real table schema in the system prompt. It knows the specific quirks of this dataset: valuations are stored in billions, country names like "UK" get expanded to "United Kingdom" before hitting the WHERE clause, and industry names have to match a fixed list that has its own mess baked in, "healthcare & life sciences" and "health" are both valid categories because the underlying data has both, so the prompt works around it instead of cleaning it.
- 02
The guard
The generated query passes through a check that only allows SELECT statements. Anything containing DROP, DELETE, INSERT, UPDATE, ALTER, TRUNCATE, CREATE, GRANT, or REVOKE is rejected before it reaches Postgres.
- 03
explainQuery
Breaks the same SQL into labeled sections, SELECT, FROM, WHERE, GROUP BY, and writes a plain-English line for each, assuming no SQL background at all.
- 04
generateChartConfig
Looks at the actual shape of the result set and picks a chart type, axis keys, and per-series colors, switching to a multi-line comparison the moment it sees more than one category to plot against the same axis.
The parsing fallback, and its visible cost
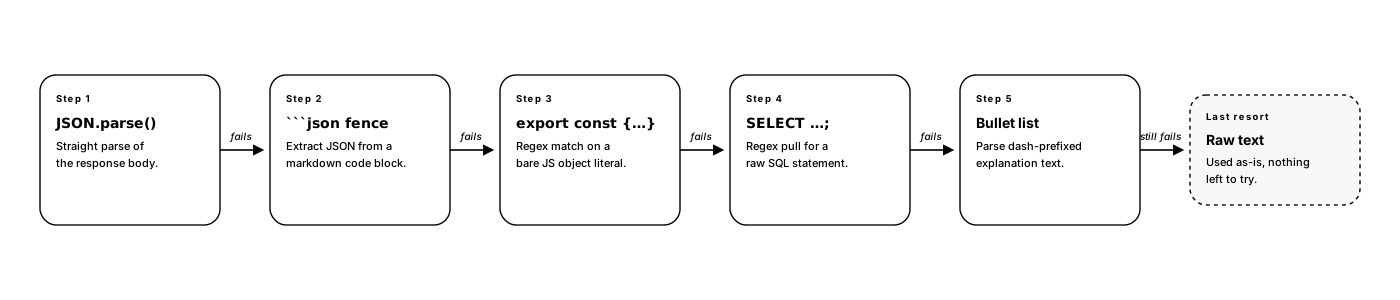
Every one of the three model calls asks for structured JSON back, and the parser doesn't just trust that it got it. It tries a direct JSON parse first, then a markdown code fence, then a regex match on a bare JS object literal, then a regex pull for a raw SQL statement, then a bullet-list parse for explanations, and only then falls back to treating the whole response as plain text. Five fallback strategies for one model call.
The chart description and takeaway text under the hero image above is what that fallback looks like in practice: when the model's JSON is missing an optional field, the app fills it with a hardcoded default instead of failing the request. That's the fail-soft path working as designed, and from the outside, a working fallback and a visible placeholder look exactly the same.
The SQL guard, and its limits
The SQL guard here is a keyword blocklist, not a parameterized query builder. That's a deliberate trade-off for a demo running on a seeded, synthetic dataset with no write path exposed anywhere else: it stops the categories of query that matter, mutation and schema changes, without needing a full query builder in front of a model that already has to write arbitrary SELECT statements by design.
The blocklist also isn't token-aware, it's a plain substring check on the lowercased query text. Ask for companies with "updated" in the name and the query gets rejected before it reaches Postgres, not because the SQL does anything unsafe, but because the word "update" appears inside a different word. A real gap, and on this dataset a rare one: no unicorn is named anything close to it.
It would not be the right call in front of a production database holding real user data, where the query surface and the trust boundary both look completely different.
Where the data actually goes
Two of the three model calls only ever see the schema and your question. generateChartConfig sees more: the actual query results, serialized as JSON, sent to the model so it can infer the right chart shape from the real data rather than just the question. On a seeded dataset of public unicorn valuations, that's a non-issue.
In front of a production database it's the same trust-boundary problem as the SQL guard, one call deeper. The SQL guard controls what comes out of the model. Nothing here controls what goes in.
Picking the right chart
On the frontend, a dynamic chart component reads that config and renders straight into Recharts: bar, line, pie, or a multi-line comparison depending on what the model chose. Colors come back as CSS variable references rather than hardcoded hex values, so every chart stays on-theme in both light and dark mode without the model ever needing to know the app's palette.
Saved queries
Every query a signed-in user runs is saved with its SQL, results, and chart config attached, so reopening a past question doesn't mean re-asking it from scratch. A suggested-queries panel gives new users a running start with pre-written questions against the seeded dataset, 1,277 real unicorn companies, rather than a blank text box and a blinking cursor.
What I'd rework
generateChartConfig is the call I'd rework first. Handing a model the raw result set and asking it to invent axis keys and colors from scratch works, but it's the least deterministic step in the pipeline, and the one most likely to pick an odd chart for a question that had an obvious right answer.
A small rules-based layer in front of it, escalating to the model only for ambiguous result shapes, would be more reliable than an LLM call on every single query. It would also cut how often the full result set has to leave the server at all, everything with an obvious shape gets classified locally, and only the genuinely ambiguous cases send a copy of the data to OpenAI.